Ozone Concentration Trends
A design value is used to compare the ambient concentrations to the air quality standard. For ozone, the design value is calculated by taking the average of each year's 4th highest 8-hour average ozone concentration over three consecutive years. Ozone concentrations are usually highest in the summer. The figure below shows each year's highest 8-hour ozone design value from 2000 – 2025 in the Sacramento region.
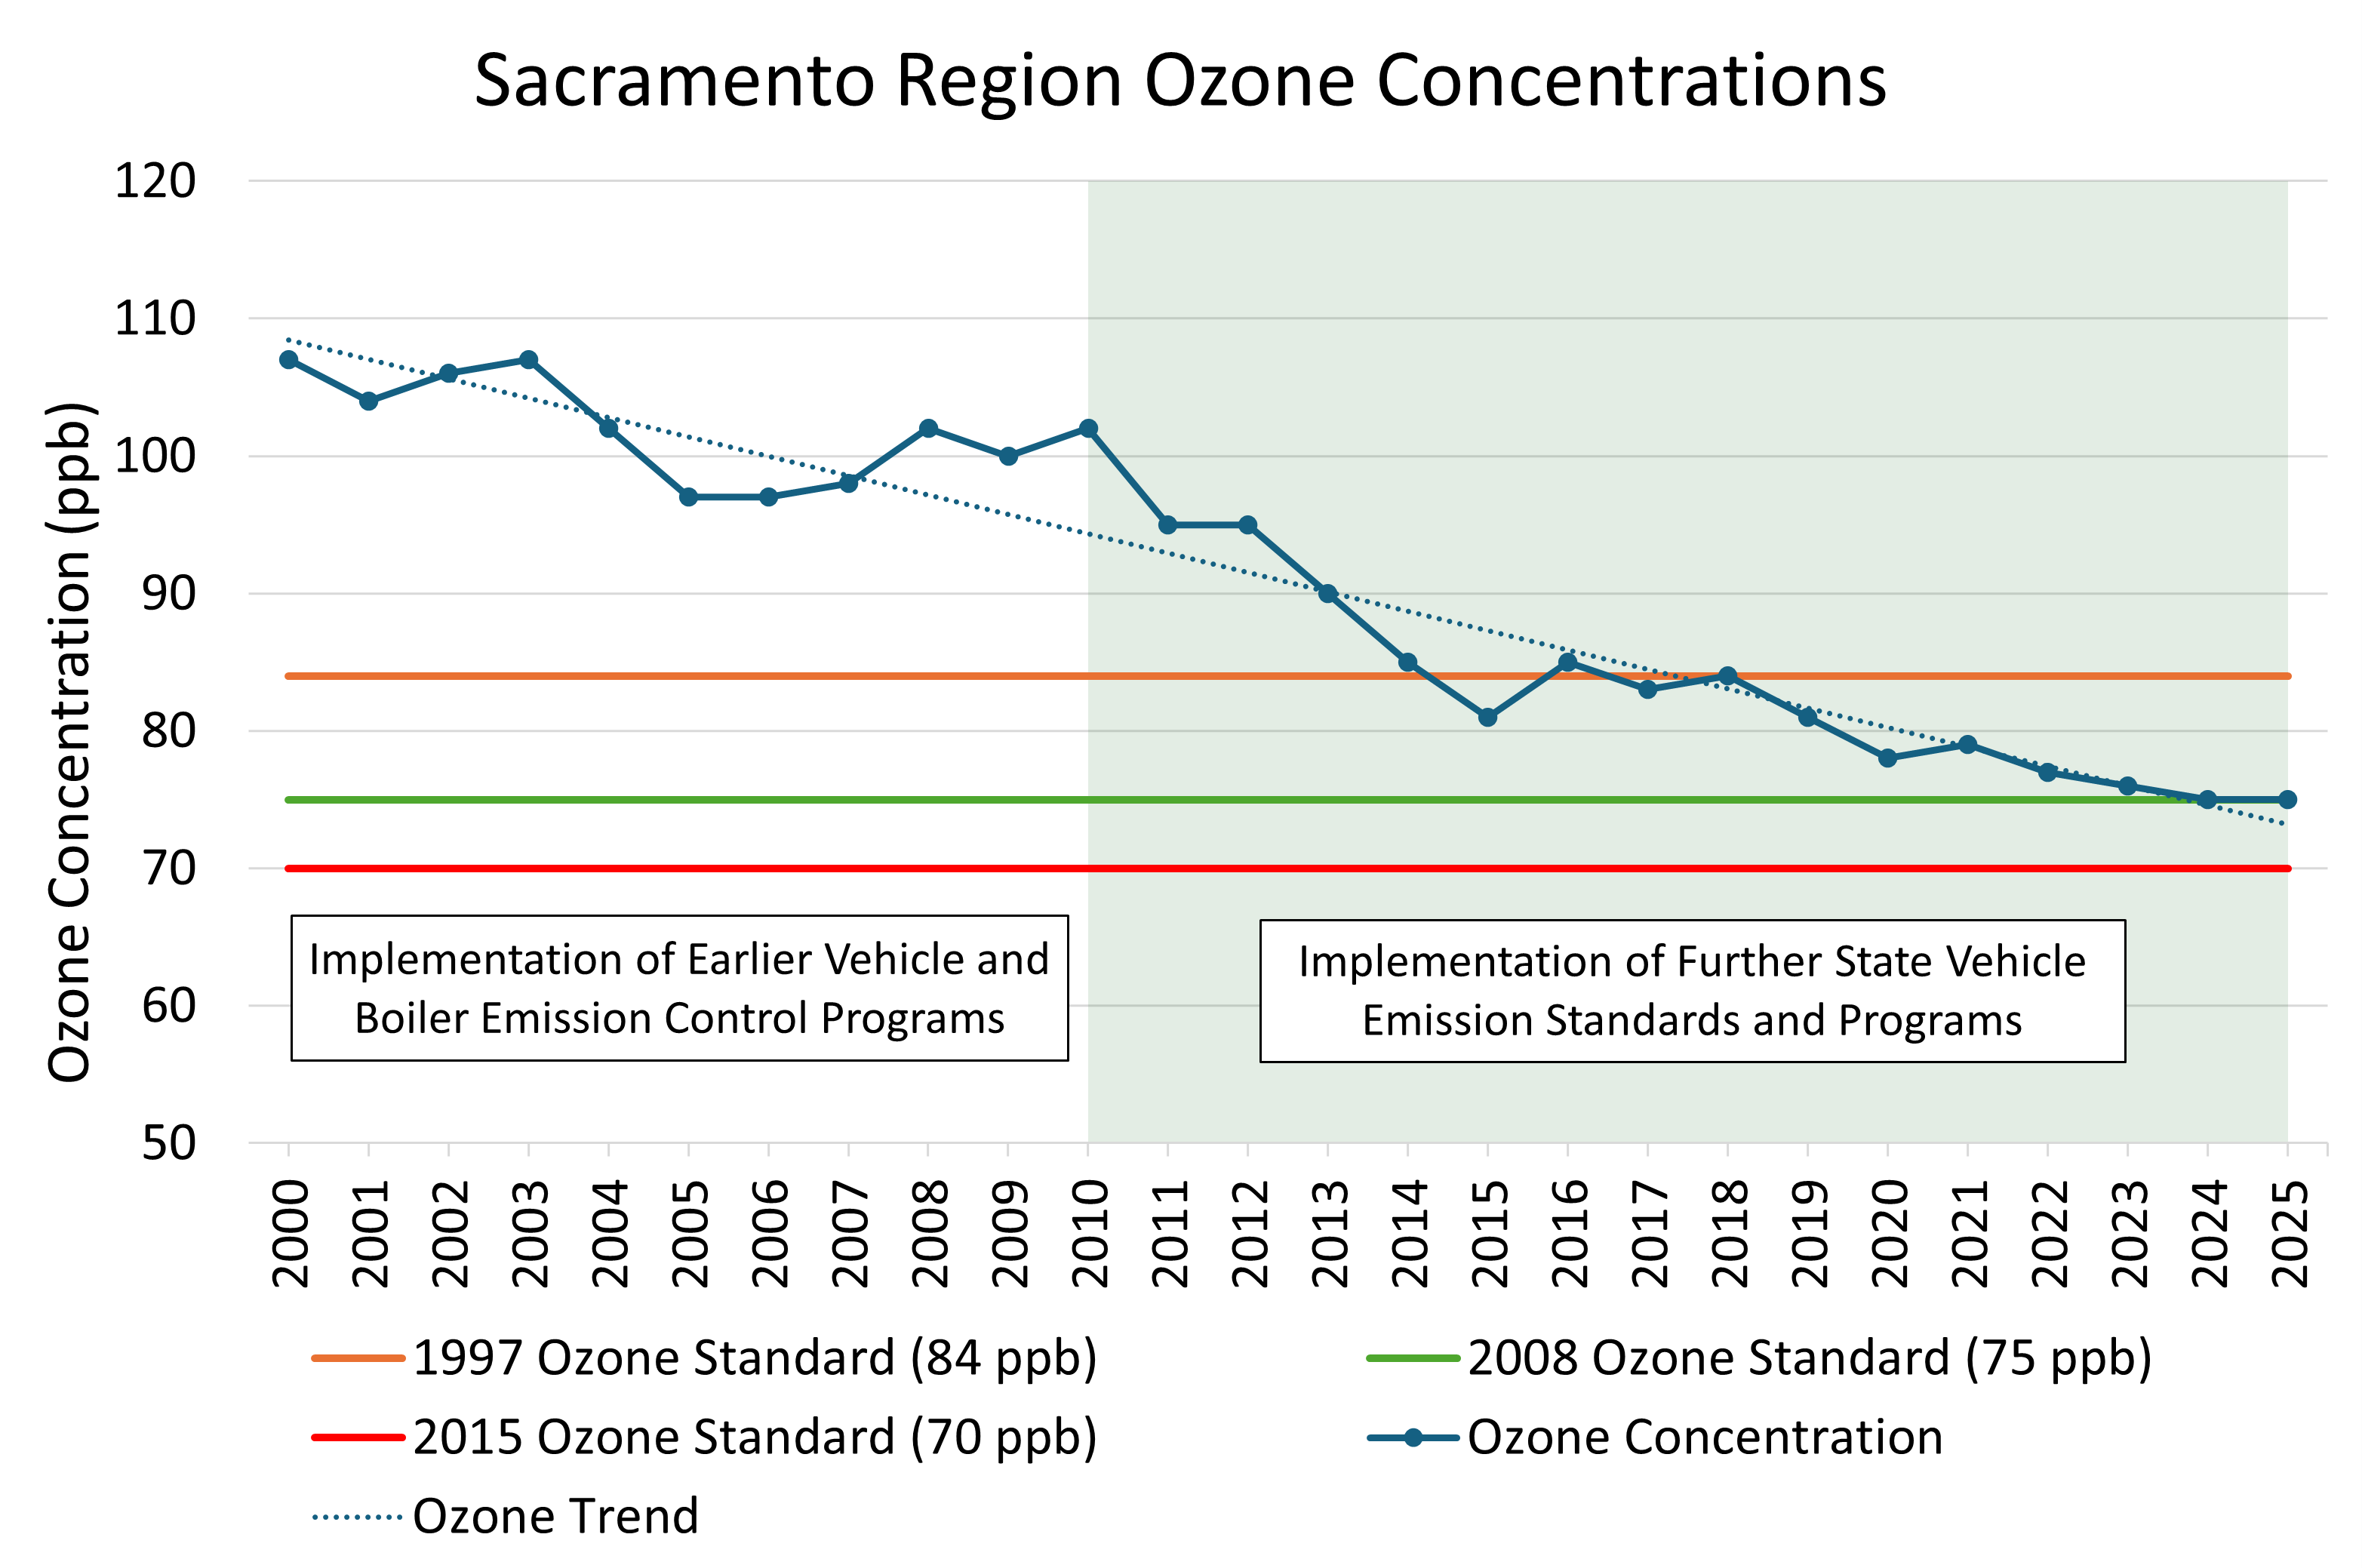
Ozone levels fell from the period 2000-2008 from NOx
emission reductions resulting from vehicle and boiler emission control programs
such as:
- SMAQMD District Rule 411 (Boilers, Process
Heaters, and Steam Generators, revised 2005);
- Rule 411.1 (Small Boilers, Water Heaters, and Process Heaters, 2005);
- CARB Transit and School Bus Fleet Rules (early 2000s); and
- Statewide Diesel Risk Reduction Plan (2000).
State vehicle emission standards
and programs phased in after 2008 that further reduced emissions include, but are not limited to:
- Heavy-Duty NOx Standards (2010); Low-Emission Vehicle Program (LEV II)
(2010);
- Cleaner In-Use Heavy-Duty Truck Regulation (Truck and Bus Rule) (2008);
- Heavy-Duty On-Board Diagnostics (2010);
- Incentive Programs (ZE Truck & Bus,
Truck Loan Assistance, Carl Moyer Program) (ongoing);
- Goods Movement Emission
Reduction Program (Proposition 1B) (2008); and
- Off-Road Engine Standards
(2010).
Particulate Matter Trends
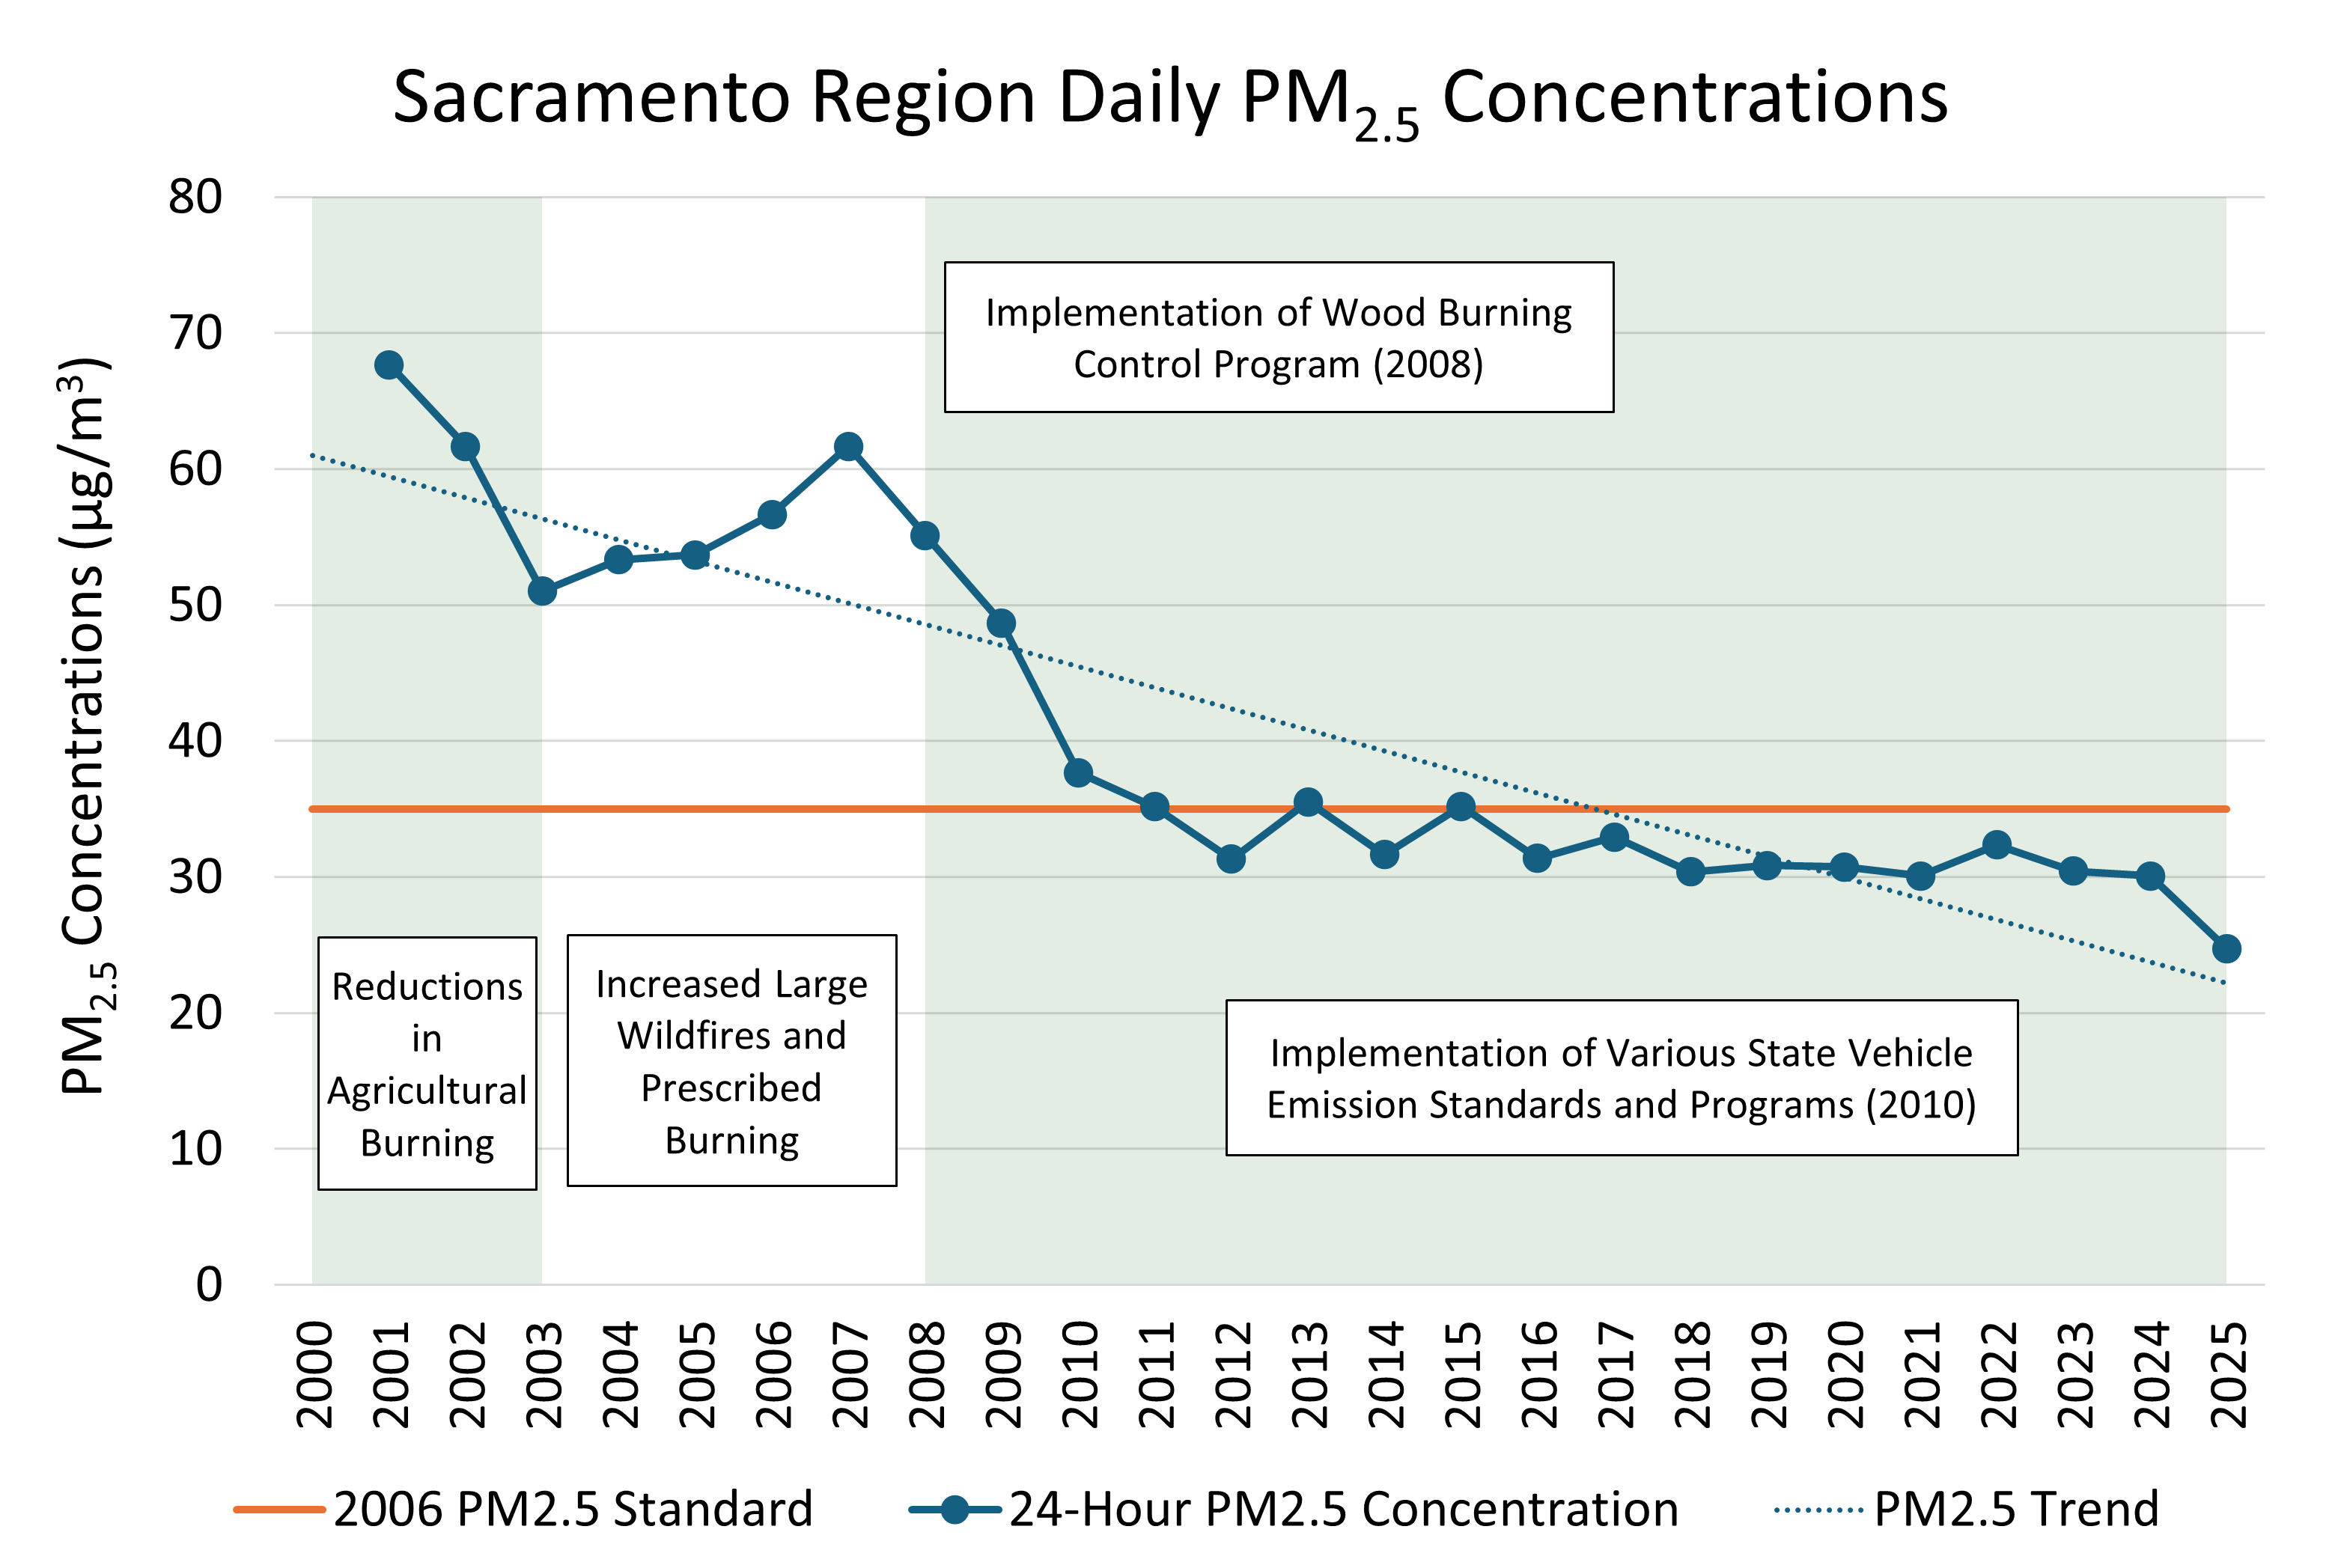
The figures below show the 24-hour PM2.5, annual PM2.5, and annual PM10 trends for the Sacramento region from 2000-2025. For federal air quality planning purposes, the figures exclude unusually high particulate matter concentrations from 2018-2022 due to wildfire smoke impacts.
Particulate Matter – 2.5 microns or less (PM2.5) 24-hour
For
particulate matter of 2.5 microns or less, the 24-hr standard design value
is calculated using the 3-year average of the 98th percentile of 24-hour PM2.5 concentrations. The figure below shows each year's peak 24-hour average PM2.5 concentration from 2000 to 2025.
The region has made significant progress in
reducing ambient PM2.5 concentrations since 2007, after implementation of
the District's wood burning prohibition rule, also known as the "Check
Before You Burn" program. PM2.5 concentrations
are normally higher during the winter months in Sacramento due to the increase
in residential wood burning activities (except during wildfire events).
Excluding wildfire impacted days, concentrations have remained at or
below the federal standard since 2013.
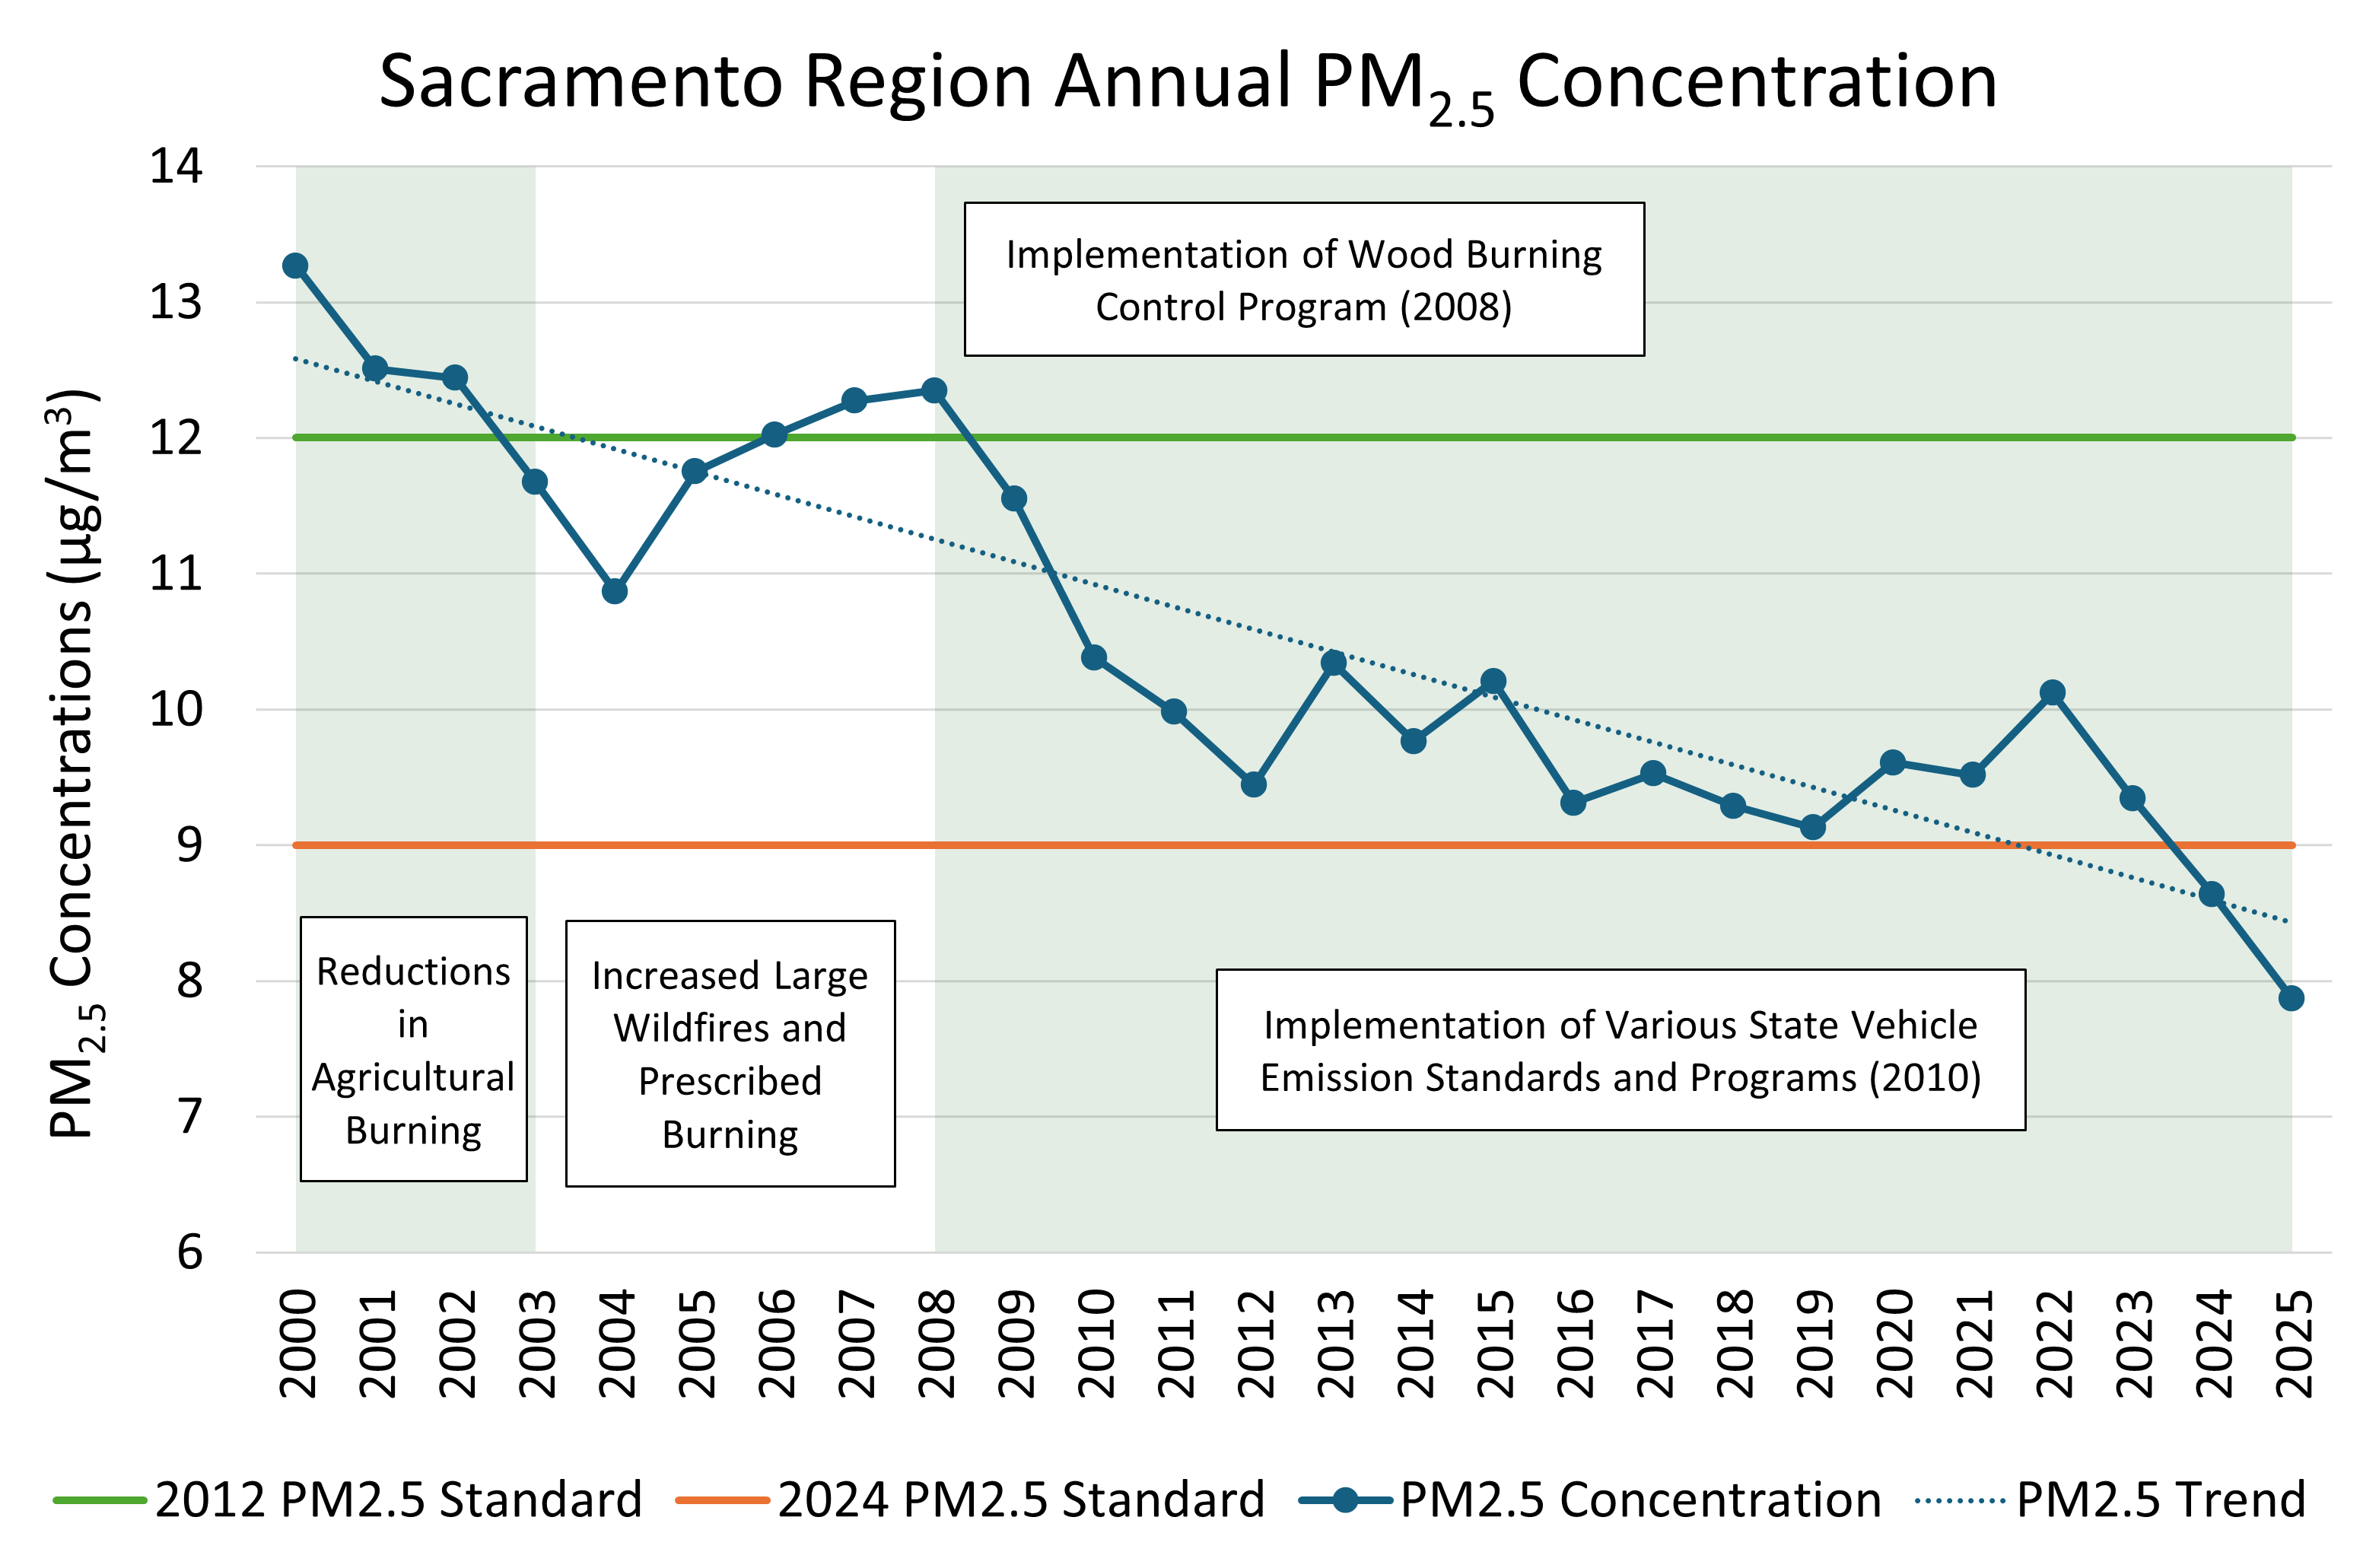
Particulate Matter – 2.5 microns or less (PM2.5)
Annual
For
particulate matter of 2.5 microns or less, the
annual standard design value is calculated using the 3-year
average of the annual mean of PM2.5 concentrations. The
figure below shows each year's average annual PM2.5 concentration from 2000 to 2025.
The data below show that once EPA makes their final determinations under the new, more stringent 2024 PM2.5 standard, the Sacramento region will already attain due to significant progress lowering PM2.5 concentrations.
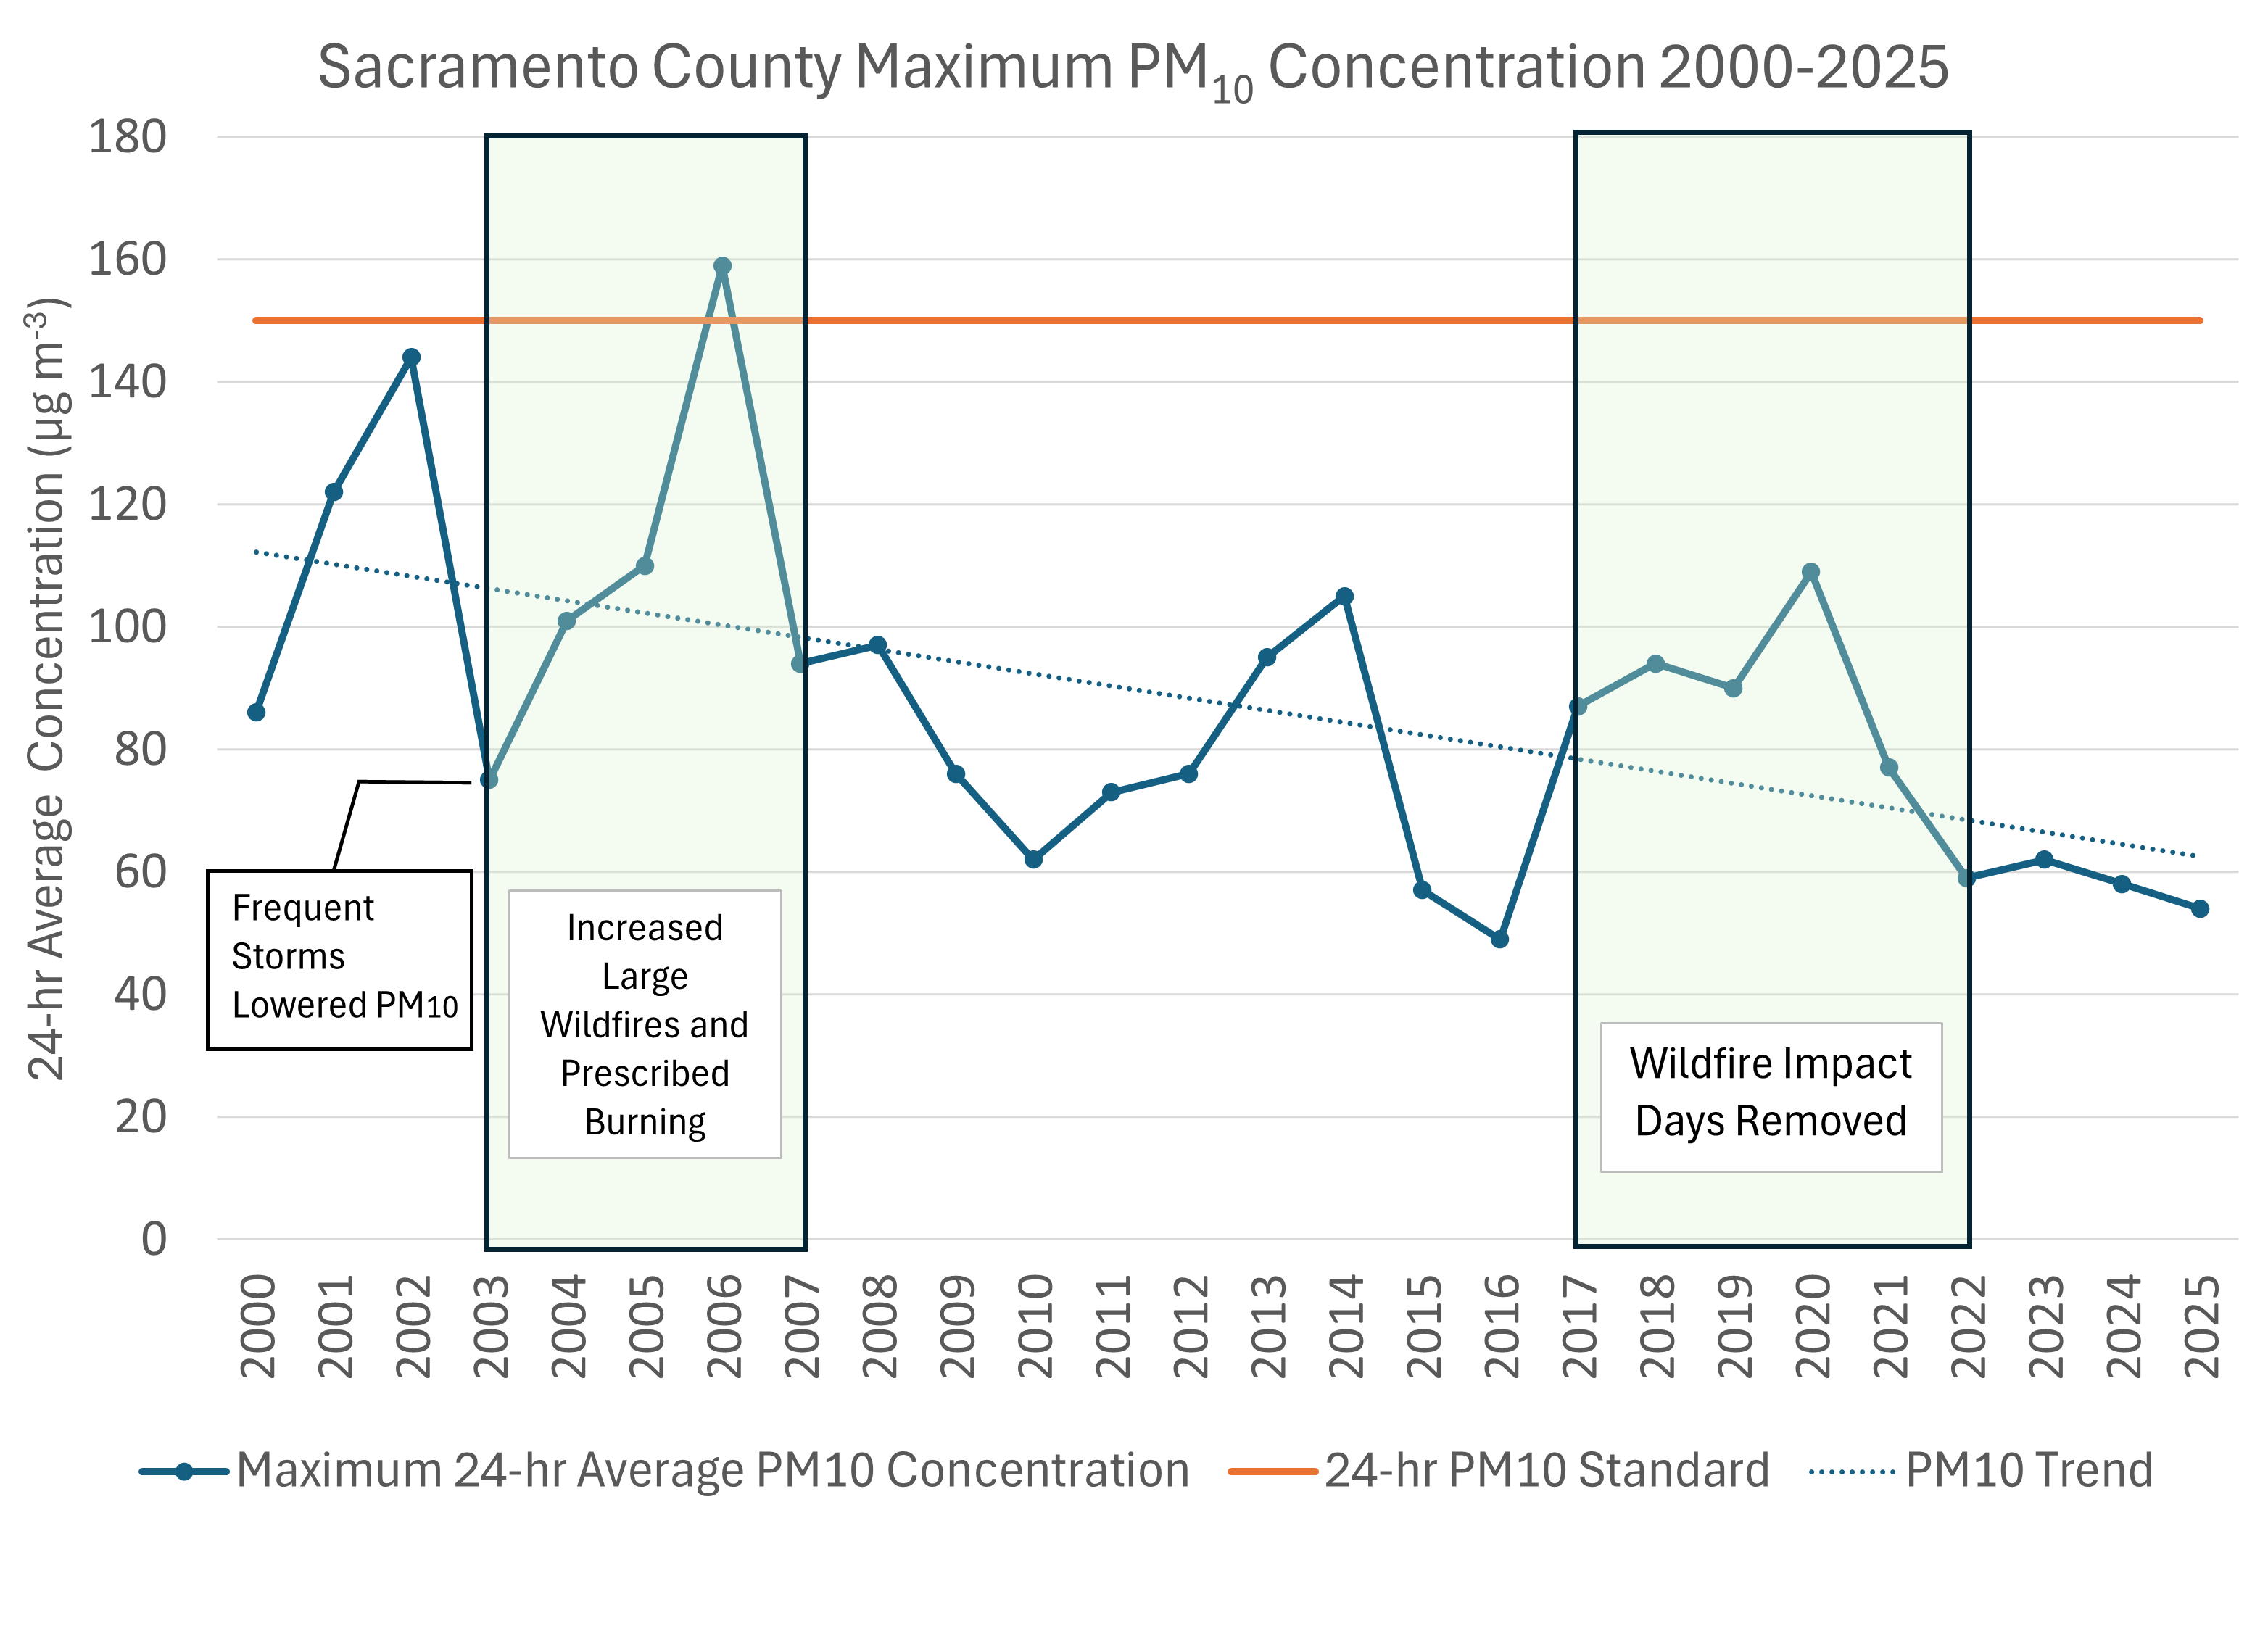
Particulate Matter – 10 microns or less
(PM10) 24-hour
For
particulate matter of 10 microns or less (PM10), the 24-hour
standard design value is calculated using the 3-year average of the
number of exceedances per calendar year. The figure below shows the
each year's maximum 24-hour average PM10 concentration from 2000 to 2025.
Data Sources: The data for the figures above were retrieved from EPA's Air Quality System on May 12, 2026.