What is MaRTy?
MaRTy is a mobile biometeorological instrument platform that was designed to measure pedestrian thermal comfort. It is a weather device that measures the many factors that contribute to how hot it feels, especially during extreme heat events. Though we typically use air temperature to measure heat, there is another metric that plays an even bigger role in how hot it feels: mean radiant temperature (MRT). MRT is a metric that tells us the total heat load a person would experience in a given location based on the incoming radiation, and it is what gives MaRTy its name. To measure MRT, MaRTy has three net radiometers that measure radiation from six directions. MaRTy also measures air temperature, relative humidity, wind speed and direction, and it records the GPS coordinates. The ability to measure MRT in real time at various outdoor locations without computer modeling is what makes MaRTy an incredibly useful tool.
MaRTy was developed at Arizona State University in response to a lack of instrumentation that could accurately capture the thermal load—or total stress due to heat—on the human body. MRT is distinct from, though related to, the two most common metrics used to measure the Urban Heat Island Effect (UHI): air and land surface temperature. Land surface and air temperatures are useful metrics for large-scale urban heat mitigation plans, however, they have some critical limitations. To implement cooling solutions that improve the comfort of pedestrians in urban settings, we must study urban heat on the hyper-local scale.
Both urbanization and climate change are increasing the intensity of extreme heat events. We cannot control when we will have heat waves, but we can control how we build our cities, and urban planners have the ability to provide cooling solutions for pedestrians during extreme heat events. MaRTy is a tool that helps explore how the built environment can exacerbate heat, the effectiveness of heat mitigation technologies and strategies, and the value of cool spaces on extremely hot day.
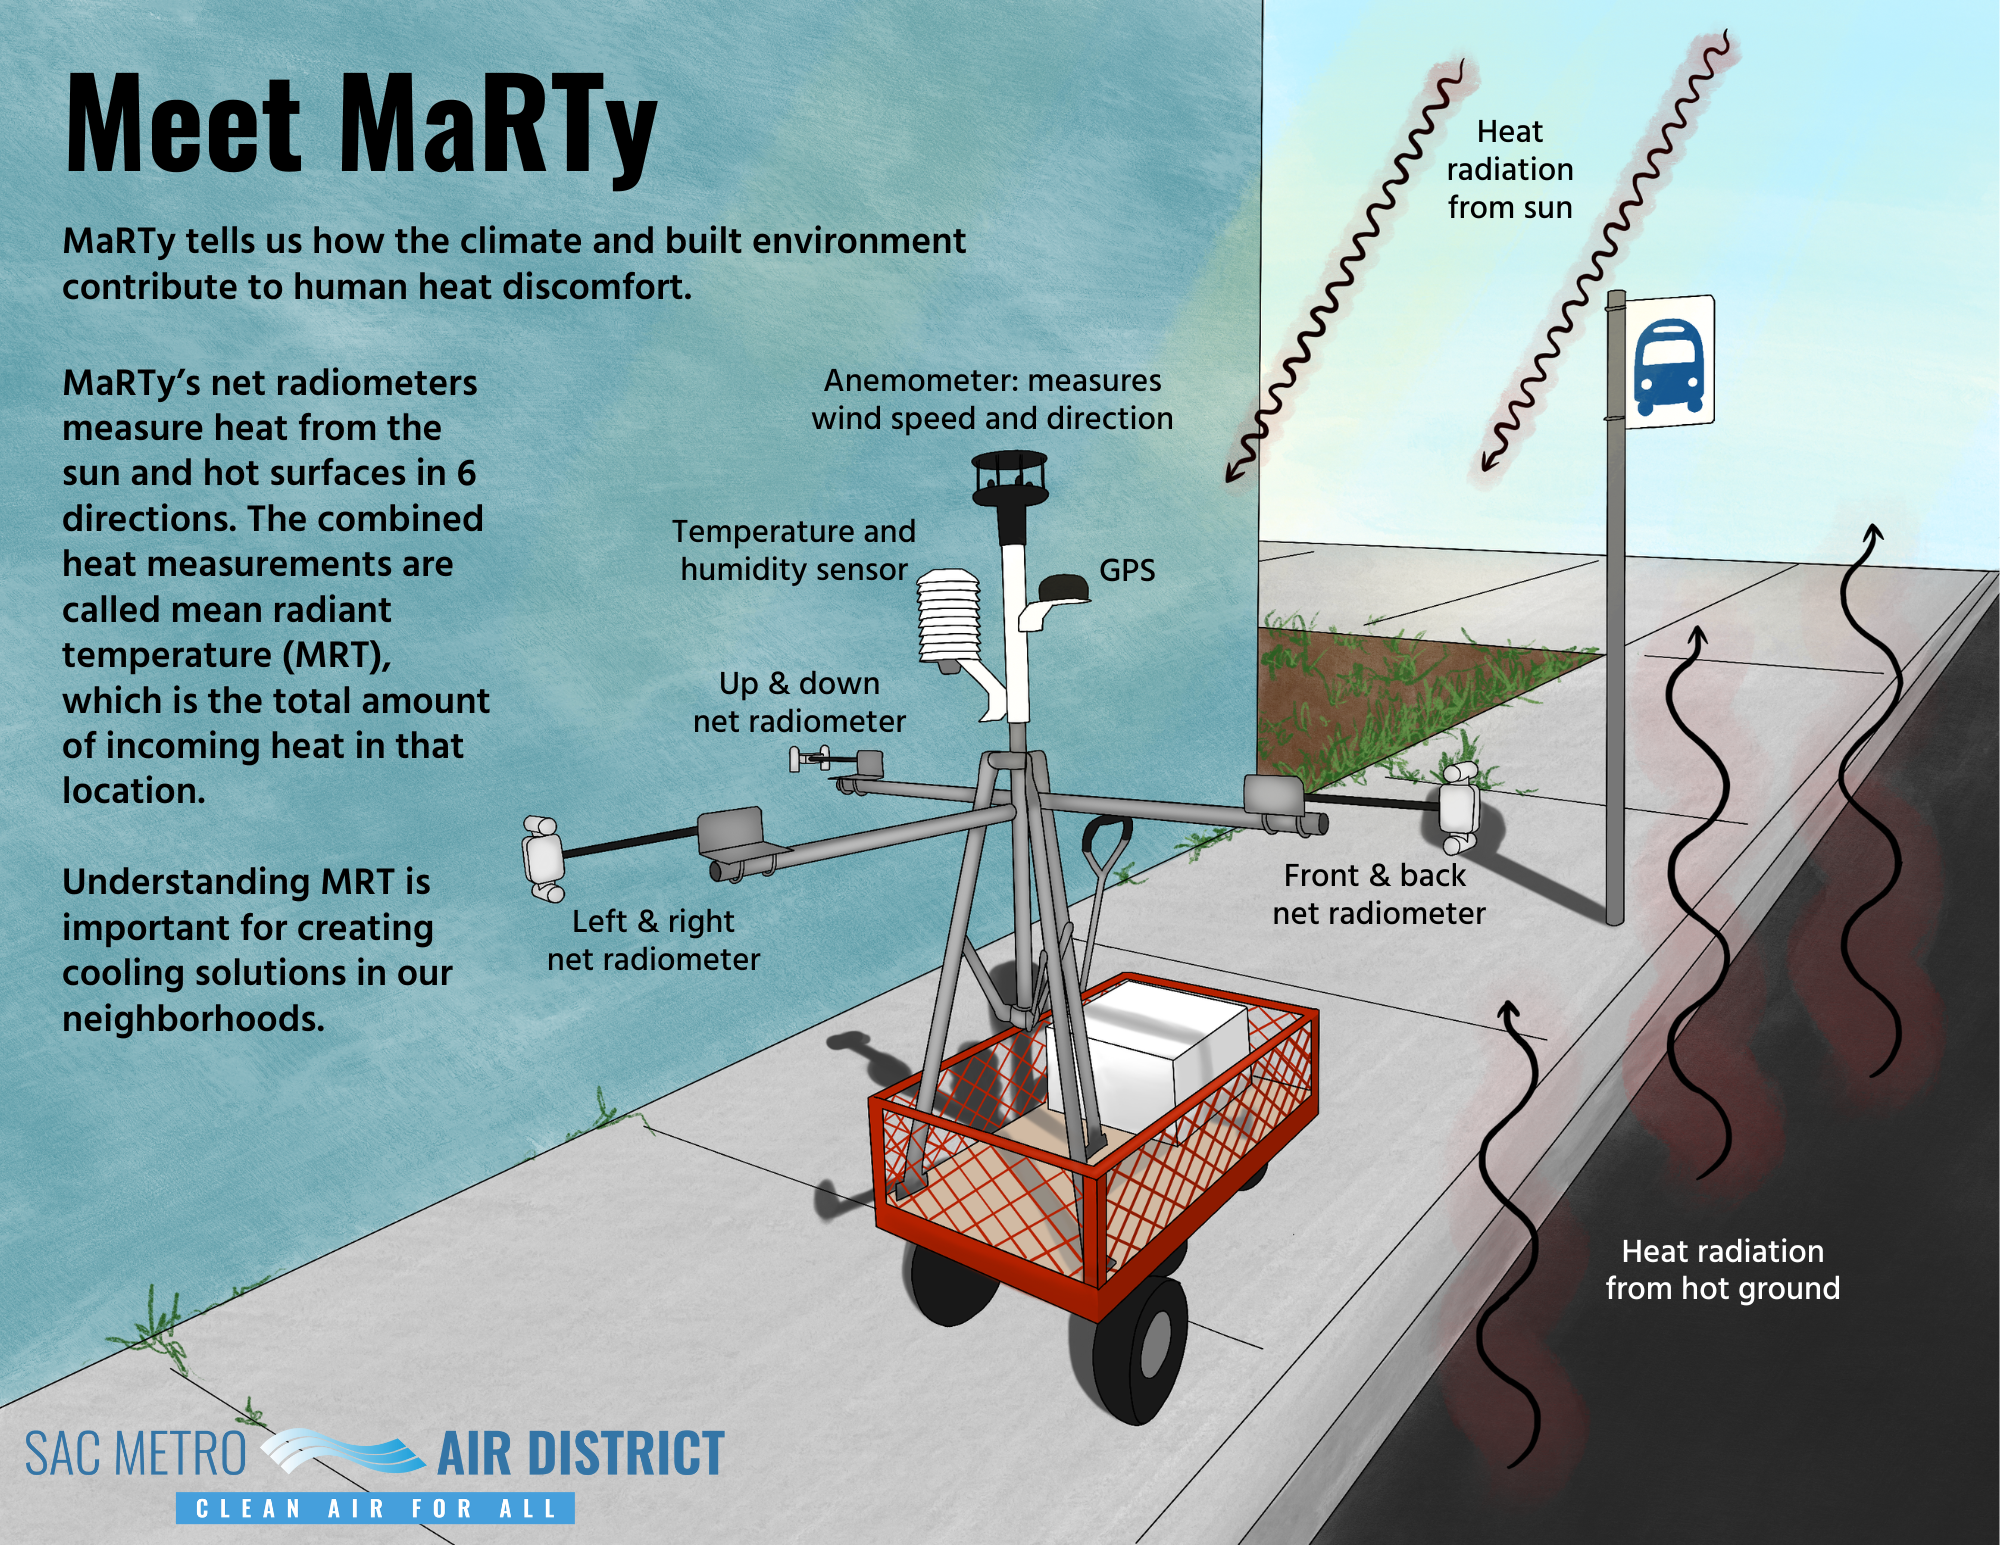 Illustration by Fiona McLaughlin
How Does Mean Radiant Temperature Work?
Using MaRTy, MRT is calculated from the combination of radiative inputs from six directions to produce a measurement of the thermal heat load. This calculation is specific to the exact location where MaRTy stands, giving it the ability to capture fine-scale thermal variations between sites. In other words, MRT can distinguish the temperature differences that humans feel depending on a variety of factors, like how sunny or shady it is or how hot the ground is below.
Though we feel a significant difference between shady and sunny locations on a hot day, the air temperature might not change very much between the two locations. This is because air temperature is not measuring radiation, yet incoming radiation has a very strong influence on the temperature that humans feel. For example, on a cold day, if the sun is shining on your skin, it will make your skin feel warm despite the low air temperature. By measuring incoming radiation from all directions, we get a more accurate picture of how much stress due to heat a person will experience in a specific location.
Although air temperature, relative humidity, and wind speed are not components of the MRT equation, they are still important metrics to consider because they affect human thermoregulation. While radiation is the dominant factor influencing human comfort in a hot, dry climate like Sacramento, CA, it is particularly dominant on days with lower wind speeds and low relative humidity—which is typically the case on the hottest days of the year. For an overview of the physical processes behind radiative inputs, air temperature, relative humidity, wind speed, and how they contribute to human thermal comfort, click here.
"Feels Like" Temperature vs Total Heat Load
Shown on this graph, we see MRT measurements taken at a Sacramento transit station in June 2025 in full sun and in the shade. Measurements were taken between 1:00-2:00 pm and 3:00-4:00 pm. As it gets hotter in the afternoon, MRT increases. In the shade, most incoming radiation is blocked and MRT remains relatively constant despite the increased heat. This demonstrates how influential shade can be at reducing incoming radiation, and therefore thermal heat load. The MRT readings from the graph may seem surprisingly high, but it is important to understand that this is not a reflection of what the temperature feels like.
Thermoregulation is the human body's process of keeping its core temperature within certain boundaries, despite the outside environment. MRT is not a "feels like" temperature of the location; it a measurement of radiation, which has the strongest influence on how the human body will thermoregulate. MRT measures the total heat load. Under extreme environmental conditions conditions, the human body will thermoregulate in an attempt to feel more comfortable. A "feels like" temperature of a given location would account for this thermoregulation process, and differs drastically from person to person based on a variety of factors, like their age and how adapted to a climate they are. A "feels like" temperature is more difficult to calculate, but by understanding that the best way to reduce how hot it feels is to reduce MRT, MaRTy can help us create cooling solutions for our neighborhoods.
Measuring Shade
On its own, MRT cannot identify the relative radiation contributions from nearby surfaces and objects. MaRTy will give you a lower MRT value if you move it from the sun to the shade, but it cannot tell you that the change is due to the shade. In the existing MaRTy literature, MRT data is often combined with fisheye photos of the sky from each collection site. These photos can make great visuals to pair with data. They are either taken with a fisheye lens on a camera pointed directly upwards or generated from Google Street View. If studying the effects of shade on heat discomfort, we can plug the fisheye photos into a computer program that separates the pixels into sky and non-sky, creating a simple fraction for the amount of visible sky in a location called Sky View Factor (SVF). This is a great way to measure the amount of available shade in a location.
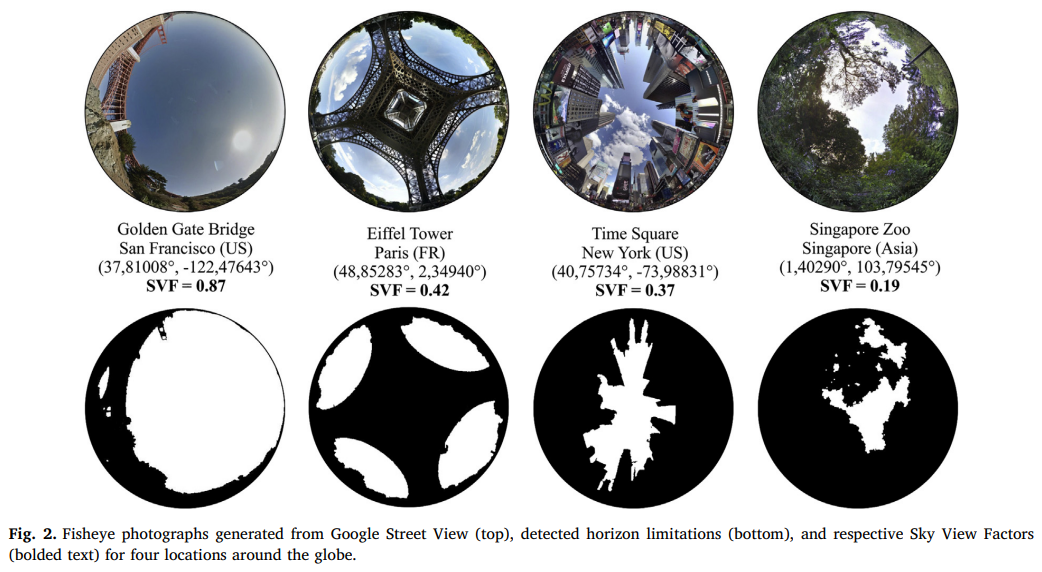 Image from Middel et al 2018: Sky View Factor footprints for urban climate modeling. https://doi.org/10.1016/j.uclim.2018.05.004
More Resources
Summer 2025 MaRTy Data and Sac Metro Air District’s Thermal Comfort Recommendations (February 2026)
Below is a list of urban extreme heat studies with research obtained using MaRTy. These studies have informed Sac Metro Air District's work.
Micrometeorological determinants of pedestrian thermal exposure during record-breaking heat in Tempe, Arizona: Introducing the MaRTy observational platform. Middel and Krayenhoff, 2019.
Solar reflective pavements—A policy panacea to heat mitigation? Middel et al., 2020.
50 Grades of Shade. Middel et al, 2021.
More than surface temperature: mitigating thermal exposure in hyper-local land system. Turner et al., 2022.
Site Design and Human Heat Burden in Pacoima, California. Turner et al., 2023.
Questions?